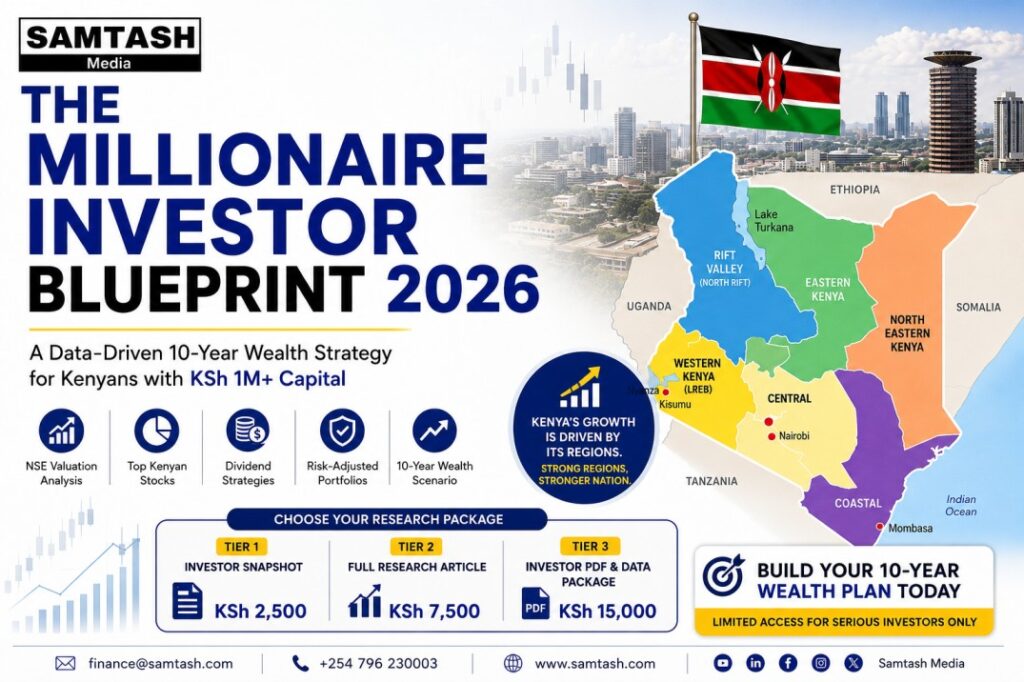
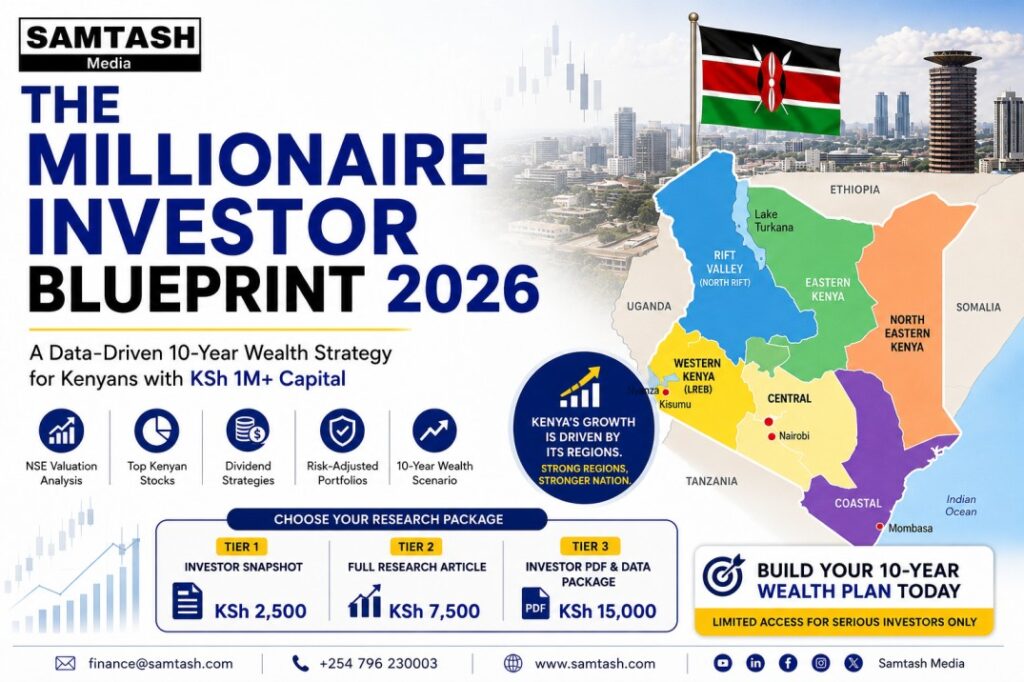
Data-driven Kenya investment guide for 2026 covering NSE stocks, Equity Group, KenGen, Safaricom, Kenya Power, bonds, MMF & ETFs. Built for investors with KES 1M+ targeting long-term 4x wealth growth over 10 years.
This Kenya investment guide 2026 analyzes NSE stocks, bonds, ETFs, and REITs for investors with KES 1 million or more seeking long-term wealth growth.
KINDLY PAY HERE: https://paystack.shop/pay/g6jo199ta8
KINDLY PAY HERE: https://paystack.shop/pay/g6jo199ta8
Order PDF Copy: +254796230003 [email protected]
Getting Started on Investing on Kenya’s Stock Market
Many Kenyans still assume the stock market is reserved for the wealthy or well-connected, but that’s increasingly outdated. Opening a CDS account requires just a smartphone, national ID, and a small initial amount, and can be done in around 30 minutes through a licensed stockbroker. You’ll typically need your ID, KRA PIN, a passport photo, and proof of a bank account. Also, some companies let you start with under KSh 100 for a single share. Settlement happens on a T+3 basis. Be aware of costs: brokerage commissions run 1.5–2.1% of transaction value, plus a CMA levy, NSE fee, and CDSC fee. These add up quickly for frequent traders.
Why Most People Lose Money Even in a Rising Market
The biggest threat isn’t bad luck, it’s behavior. Panic selling is the most common mistake: investors rush to sell during a drop out of fear, then miss the recovery. During the 2020 COVID crash, those who held diversified portfolios eventually recovered, while those who fled to cash often locked in losses and re-entered later at higher prices.
The opposite mistake, buying because “everyone’s doing it” (as seen in the 2021 meme-stock frenzy) fuels bubbles that leave latecomers holding overpriced shares when they burst. A third pattern is overconcentration: putting too much into one stock or sector out of familiarity or overconfidence, which amplifies sector-specific shocks and makes it harder to admit and exit losing positions. And frequent trading, driven by a belief you can consistently outguess the market, often just erodes returns through fees and poor timing.
The common thread: these mistakes aren’t about which stock to pick, they’re about whether your plan can survive your own emotions during a downturn.
A Word on the NSE Right Now
The Kenyan market has seen a strong post-2025 bull run, with market cap crossing roughly KSh 2.9 trillion and several listed companies posting triple-digit gains. Strong runs like this attract a wave of new investors, and history shows they’re often followed by corrections that test exactly the discipline described above.
What’s Inside the Full Guide
The full guide goes deeper into specific opportunities across ten assets in three tiers. Including our highest-conviction NSE picks, income-generating compounders, and diversifiers offering global and real-estate exposure. Along with how we’d think about position sizing, and names we’re cautious about as well as ones we’re more positive on.
Everything in the full guide reflects Samtash Media’s own estimates, opinions, and speculative projections, not verified facts or guarantees. Figures may be approximate or outdated. No outcome is guaranteed; you could lose money, including your principal. This is not financial advice, verify independently and consult a CMA-licensed advisor.
🟢 TIER 1 INVESTOR SNAPSHOT
Price: KSh 2,500
Access: Basic Locked Section (Top 10 NSE Wealth Picks Overview)
Welcome to the Investor Snapshot
This is your entry point into the Samtash Investment Intelligence System. A structured, data-driven breakdown of Kenya’s most powerful wealth-building assets.
This Tier is designed for investors with KES 1,000,000+ capital who want clarity, not noise.
You are not buying hype.
You are accessing a filtered view of Kenya’s strongest long-term wealth opportunities based on:
- NSE performance data
- Dividend yield stability
- Earnings strength (P/E ratios)
- Sector dominance
- 10-year compounding potential
What You Get in Tier 1
In this section, you unlock:
✔ The Top 10 Kenyan wealth-building assets overview
✔ Simplified explanation of why each asset matters
✔ Basic entry-level investment logic
✔ Risk classification (Low / Medium / High)
✔ Long-term wealth direction (not short-term trading noise)
The Top 10 Wealth Assets (Snapshot View)
Below is your filtered investor map:
1. Equity Group Holdings (EQTY)
Africa’s most efficient banking compounder
- Strong dividend engine
- Low valuation vs peers
- Long-term reinvestment growth story
2. KenGen (KEGN)
Kenya’s renewable energy backbone
- Geothermal dominance
- High dividend consistency
- Undervalued vs global energy peers
3. Kenya Power (KPLC)
Monopoly utility turnaround opportunity
- Extremely low P/E structure
- High volatility but strong recovery signals
- Sensitive to policy + debt restructuring
4. Safaricom (SCOM)
East Africa’s blue-chip anchor
- M-PESA ecosystem dominance
- Stable cash flow generator
- Lower risk, steady compounding
5. Infrastructure Bonds (IFB – CBK)
Government-backed fixed income layer
- Tax-free interest advantage
- Capital preservation tool
- Portfolio stability engine
6. Money Market Funds (MMF)
Liquidity & opportunity reserve
- 11%–12% yield environment (variable)
- Used for buying dips in equities
- Short-term capital parking
7. NSE Diversified Basket
Index-style exposure to Kenyan equities
- Reduces single-stock risk
- Tracks NSE 20 / NASI growth cycles
- Ideal for passive investors
8. Satrix MSCI World ETF
Global diversification through NSE
- Exposure to US & global giants
- FX hedge against shilling depreciation
- Long-term growth stabilizer
9. Acorn REIT (D-REIT / I-REIT)
Structured real estate income
- Regulated by CMA
- Rental income distribution model
- Student housing demand advantage
10. Peri-Urban Land (Selective Entry Only)
Long-term speculative real estate
- High return potential (location-driven)
- High illiquidity & fraud risk
- Only for experienced capital allocators
Key Investor Reality Check
This Tier is built on one principle:
Wealth is not created by choosing many assets. It is created by understanding a few deeply and holding them long-term.
Most investors lose money in Kenya because they:
Risk Classification Summary
- Low Risk: Safaricom, IFB, MMF
- Medium Risk: Equity, KenGen, REITs, ETF
- High Risk: Kenya Power, Land (location-dependent)
What Comes Next (Tier 2 Preview)
If Tier 1 gives you direction, Tier 2 gives you precision:
You will unlock:
- Full valuation breakdowns (P/E, ROE, EPS growth)
- 10-year compounding simulations
- Dividend reinvestment modeling
- Entry timing logic (when to buy & accumulate)
- Portfolio construction strategy for KES 1M–10M investors
Final Note
This is not financial advice. It is structured investment research designed to help you think like an institutional investor rather than a retail trader.
If you are serious about building long-term wealth in Kenya’s markets, Tier 1 is your foundation.
🔵 TIER 2 RESEARCH ACCESS
Price: KSh 7,500
Access: Full Investment Analysis (NSE Valuations, Dividends & 10-Year Models)
Welcome to Tier 2 Research Layer
You are now entering the core intelligence layer of the Samtash Investment System.
Unlike Tier 1 (overview), this section removes simplification and exposes:
- Real valuation models
- Earnings strength (EPS trends)
- P/E comparison vs global markets
- Dividend sustainability analysis
- Institutional risk weighting
- 10-year compounding simulations
This is the level used to evaluate whether an asset is undervalued, fairly priced, or structurally mispriced.
1. MARKET CONTEXT, WHY THESE VALUATIONS MATTER
The Nairobi Securities Exchange (NSE) is currently in a structural re-rating phase driven by:
- Return of domestic institutional capital
- Stabilizing inflation environment (~4–6% range)
- Increased dividend-seeking behavior
- Foreign investor re-entry after FX stabilization
- Energy + banking sector earnings recovery
This creates valuation inefficiencies, especially in large-cap stocks.
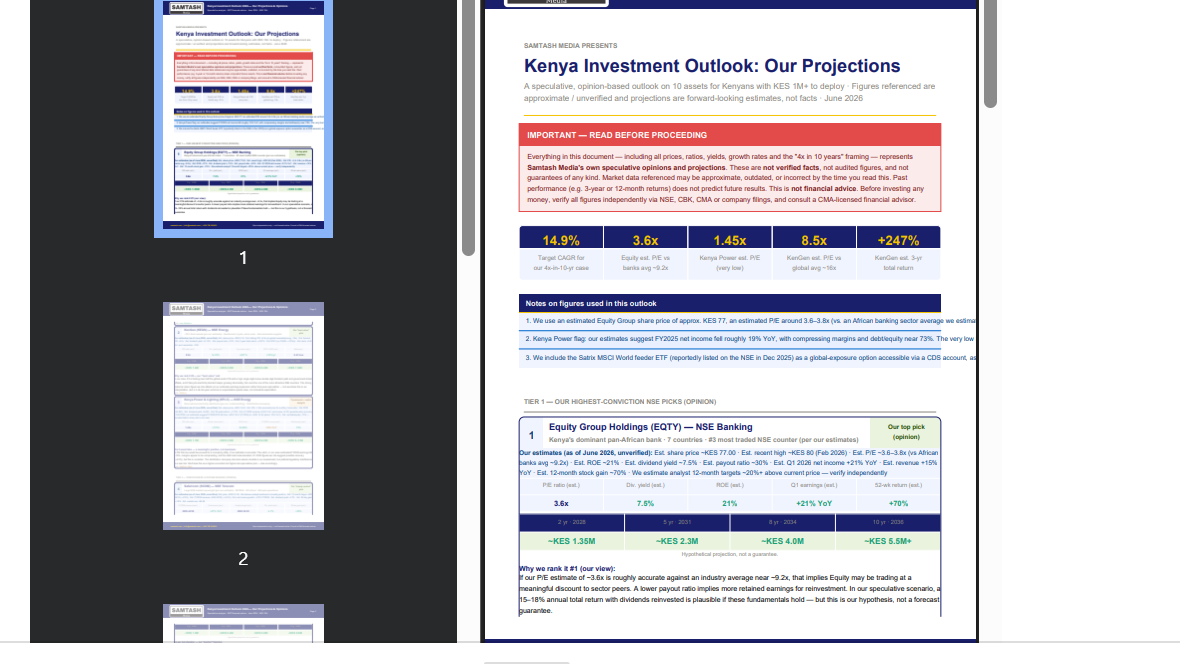
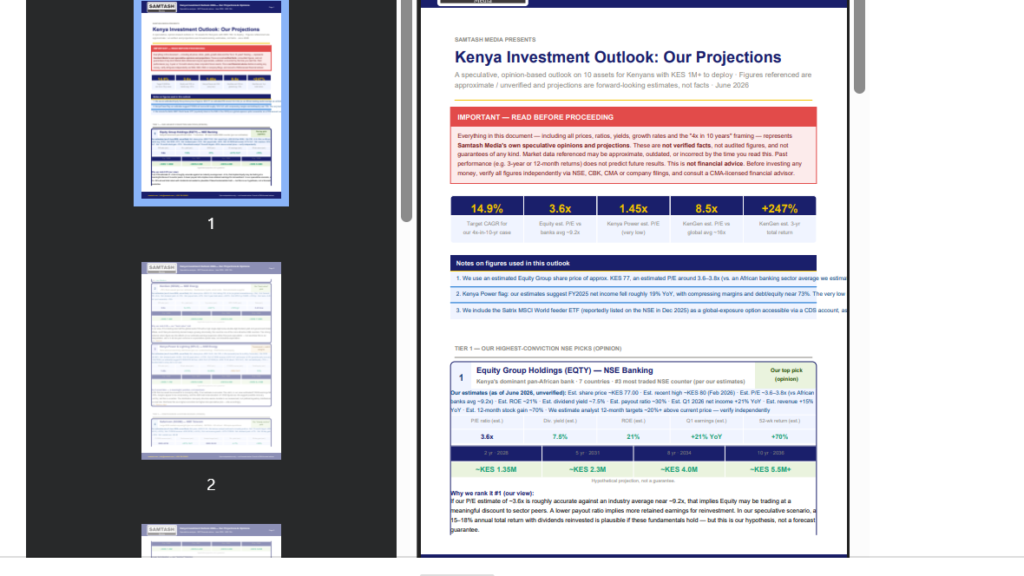
2. EQUITY GROUP (EQTY) VALUATION DEEP DIVE
Key Metrics
- P/E Ratio: 3.6x – 3.8x
- Industry Average (Africa Banks): 9.2x
- ROE: ~21%
- Dividend Yield: ~7.5%
- Payout Ratio: ~30%
Interpretation
Equity Group trades at a significant discount to regional peers despite:
- Higher ROE than average African banks
- Strong multi-country diversification (7 markets)
- Stable dividend policy
- Consistent earnings growth trend
10-Year Logic
If earnings compound at ~12–15% annually:
- Dividends reinvested → exponential compounding
- P/E reversion alone can add 30–60% upside expansion
Verdict
Equity Group is not a growth gamble, it is a discounted compounding machine.
3. KENGEN (KEGN) ENERGY MONOPOLY MODEL
Key Metrics
- P/E Ratio: 8.5x
- Global Renewable Avg: ~16x
- Dividend Yield: 9–12%
- EPS Growth (3Y CAGR): ~74%
- Beta: 0.43 (low volatility)
Interpretation
KenGen is priced at half the valuation of global renewable energy firms, despite:
- Geothermal dominance (Kenya’s strongest energy advantage)
- Government-backed demand stability
- Expanding renewable mix (wind + solar + hydro)
- Strong cash flow consistency
10-Year Logic
KenGen’s model is driven by:
- High dividend reinvestment effect
- Energy demand expansion in Kenya
- Structural underpricing vs global peers
Verdict
KenGen is a “slow explosive compounder” low volatility, high dividend reinvestment acceleration.
4. KENYA POWER (KPLC) TURNAROUND ASSET MODEL
Key Metrics
- P/E Ratio: 1.45x
- ROE: ~24.8%
- Dividend Yield: ~6.5%
- Debt/Equity: ~73%
- Earnings Trend: -19% FY decline (recent year)
Interpretation
KPLC is the most mispriced utility on the NSE, but also the most structurally complex:
Strengths
- Monopoly distribution rights
- Extremely low valuation
- Revenue recovery signs in 2026
Risks
- High debt burden
- Political tariff sensitivity
- Earnings volatility
10-Year Logic
Returns depend on:
- Debt restructuring success
- Tariff stabilization
- Operational efficiency improvement
If recovery continues, valuation rerating is possible.
Verdict
KPLC is not a passive investment, it is a regulated turnaround bet.
5. SAFARICOM (SCOM) BLUE CHIP CASH ENGINE
Key Metrics
- Revenue Growth: ~9–10%
- Net Income Growth: ~30%+ (FY cycles vary)
- Dividend Yield: ~4–5%
- Market Cap: Largest in East Africa
Interpretation
Safaricom is a cash-flow stabilizer, not a high-growth asset:
- M-PESA ecosystem dominance
- Predictable revenue streams
- High institutional ownership
- Strong balance sheet
10-Year Logic
Key driver:
- Ethiopia business eventual profitability (FY2027+)
- Telecom infrastructure expansion
- Regional fintech scaling
Verdict
Safaricom is the portfolio anchor, stability + compounding, not acceleration.
6. PORTFOLIO THEORY, WHY THESE 4 ASSETS MATTER MOST
The core wealth engine is:
- Equity Group
- KenGen
- Safaricom
- Kenya Power (selectively)
These form the “Kenya Core Compounding Quadrant”
Everything else (ETF, REIT, bonds, MMF) is:
- Risk balancing
- Liquidity management
- Global hedge protection
7. 10-YEAR COMPOUNDING LOGIC (SIMPLIFIED MODEL)
To reach 4x wealth (KES 1M → KES 4M):
Required CAGR:
~14.9% annually
This is achieved through:
- Dividend reinvestment
- Sector rotation cycles
- Valuation re-rating (P/E expansion)
- Tactical allocation shifts using MMF
8. RISK STRUCTURE (INSTITUTIONAL VIEW)
- Low Risk: Safaricom, Bonds, MMF
- Medium Risk: Equity, KenGen, ETF
- High Risk: Kenya Power, Land
9. KEY INVESTOR INSIGHT
The real edge is not picking winners, it is understanding valuation gaps before the market corrects them.
Most retail investors fail because they:
- Buy during hype cycles
- Ignore dividend reinvestment
- Do not understand P/E compression/expansion
- Exit during volatility instead of accumulation phases
FINAL TRANSITION TO TIER 3
Tier 2 gives you:
✔ Full valuation logic
✔ Earnings understanding
✔ 10-year projections
✔ Risk-adjusted reasoning
But it does NOT give you:
❌ The actual downloadable system
❌ Portfolio execution tools
❌ Allocation calculators
❌ PDF + structured execution model
That is Tier 3
Where strategy becomes execution.
🔴 TIER 3 INVESTOR TOOLKIT ACCESS
Price: KSh 15,000
Access: Full PDF + Portfolio Tools + Execution System
Welcome to Tier 3 Execution Layer
You are now accessing the complete investment execution system behind the Samtash Wealth Blueprint.
This is not theory.
This is the layer where:
- Strategy becomes allocation
- Analysis becomes action
- Information becomes portfolio construction
Everything here is designed for investors managing KES 1M+ capital who are ready to deploy, not just study.
WHAT YOU GET IN TIER 3
KINDLY PAY HERE: https://paystack.shop/pay/g6jo199ta8
Order PDF Copy: +254796230003 [email protected]
✔ 1. FULL INVESTMENT PDF (DOWNLOAD)
You receive the complete institutional report:
“Kenya Investment Guide 2026, Wealth Blueprint Edition”
Includes:
- NSE stock deep analysis (EQTY, KPLC, KEGN, SCOM)
- Dividend + earnings models
- 10-year compounding projections
- Risk scoring system
- Inflation-adjusted returns
- Sector comparison models
- Portfolio construction logic
📌 This is the same report used as the foundation of this entire system.
✔ 2. PORTFOLIO ALLOCATION SYSTEM (KES 1M–10M)
A structured allocation model that shows:
- How to split capital across assets
- How to rebalance annually
- How to reduce downside risk
- How to compound dividends efficiently
Example Core Allocation Model:
- 30% Equity Group (EQTY)
- 20% KenGen (KEGN)
- 15% Safaricom (SCOM)
- 15% Kenya Power (KPLC)
- 10% Infrastructure Bonds (IFB)
- 5% Money Market Fund (MMF)
- 5% Global ETF / REIT hedge
✔ 3. INVESTMENT DECISION MATRIX
A structured scoring system used to evaluate any NSE asset based on:
- P/E valuation attractiveness
- Dividend sustainability
- Earnings growth trend
- Sector dominance
- Risk exposure
- Liquidity profile
Each asset is scored to determine:
- BUY
- ACCUMULATE
- HOLD
- REDUCE EXPOSURE
✔ 4. MARKET DIP STRATEGY (MMF DEPLOYMENT SYSTEM)
You are trained on how to use MMF as a weapon, not savings.
Strategy includes:
- When to deploy cash into equities
- What counts as a “buy-the-dip zone” (15%+ corrections)
- How to rotate liquidity into undervalued NSE stocks
- How institutions accumulate positions quietly
✔ 5. 10-YEAR WEALTH ROADMAP
This section shows how KES 1M becomes:
- KES 1.6M (2 years)
- KES 2.5M–3.5M (5 years)
- KES 4M–6M (8 years)
- KES 5M–10M+ (10 years, scenario-based)
📌 All projections assume:
- Dividend reinvestment
- No panic selling
- Cyclical NSE recovery phases
- Stable macro environment
✔ 6. RISK MANAGEMENT FRAMEWORK
You learn how to survive volatility:
- How to handle NSE corrections
- When NOT to sell
- How to avoid liquidity traps (land, illiquid stocks)
- How to balance high-risk vs low-risk allocation
✔ 7. GLOBAL HEDGE STRATEGY (ETF + FX PROTECTION)
Includes:
- Satrix MSCI World ETF role in Kenyan portfolios
- Currency depreciation hedge logic
- Why USD exposure matters for KES investors
- How global markets stabilize NSE volatility exposure
INVESTOR REALITY CHECK
This tier is designed for serious investors only.
It assumes:
- You already understand risk basics
- You are managing real capital (KES 1M+)
- You are not looking for speculation or quick flips
- You are building long-term wealth over 5–10 years
WHAT THIS TIER DOES NOT PROMISE
- No guaranteed returns
- No “get rich quick” outcomes
- No fixed market predictions
Instead, it provides:
A structured probability-based system for long-term capital growth.
FINAL PRINCIPLE
Wealth is not created by prediction. It is created by allocation, discipline, and time in the market.
NEXT STEP
Once you complete Tier 3, your system becomes:
✔ Analysis (Tier 1)
✔ Deep valuation (Tier 2)
✔ Execution system (Tier 3)
This is now a complete investment product ecosystem, not just content.